How to Read a Stock Chart: Candlesticks, Trend, Support and Resistance for Beginners
How to read the price chart of a stock or cryptocurrency: the candlestick chart, trend, support and resistance, volume and timeframes. What technical analysis can and cannot do.
In short: a chart shows the development of a price over time. What matters is choosing a suitable timeframe, recognising the trend (rising, falling, sideways) and the levels of support and resistance. Technical analysis helps with orientation, but it does not predict the future. For a long-term investor the quality of the company matters more than the shape of the chart.
Line chart and candlesticks
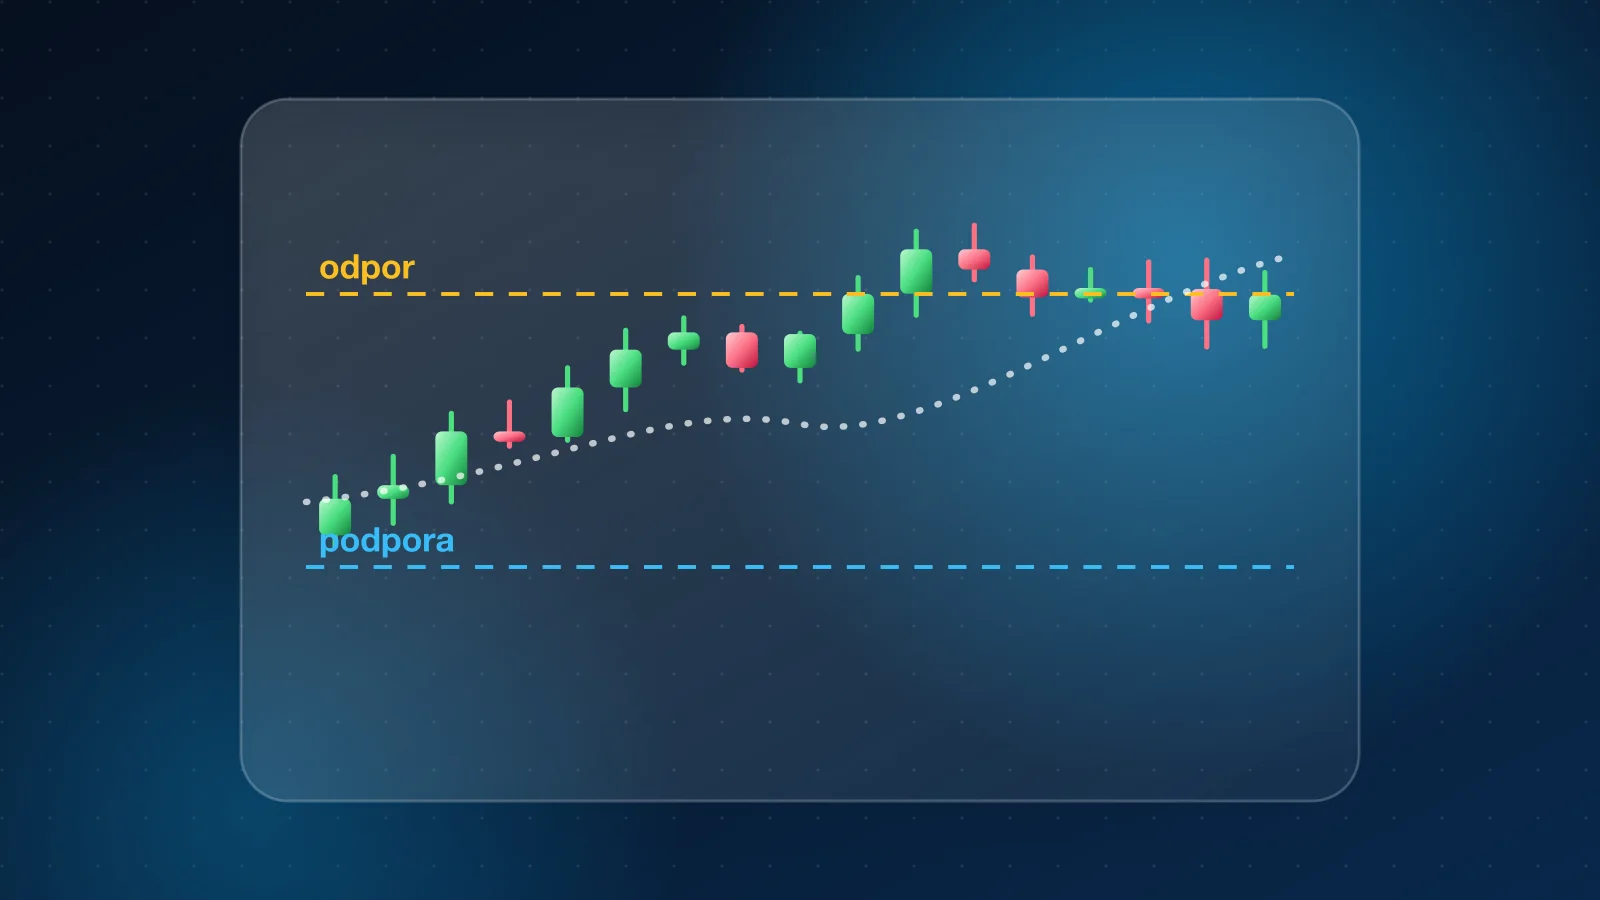
A line chart connects closing prices and is good for an overview. A candlestick chart shows four prices in one period: open, close, high and low. The body of a candle is the difference between the open and the close, and the wicks show the extremes. A rising candle is usually green, a falling one red.
Timeframe
The same instrument looks different in different timeframes. A short timeframe (minutes, hours, days) shows noise and short-term moves. A long one (years) shows the real trend. In our charts you will find the timeframes 1M, 6M, YTD, 1Y, 5Y and MAX, and for cryptocurrencies also 4H, 1D and 1W. YTD means year to date. For a long-term investor timeframes from a year upward are enough. Example: the chart on the Bitcoin page.
Trend
- Rising trend: higher highs and higher lows.
- Falling trend: lower highs and lower lows.
- Sideways trend: the price moves between two levels.
A common rule says it is more advantageous to go with the trend than against it, but trends change and no rule works every time.
Support and resistance
Support is a price level at which declines often end because buyers appear. Resistance is a level at which rises often end because sellers prevail. Once the price breaks through a level, the roles can reverse. They are zones, not exact lines.
Volume
Volume is the number of trades in a period. A price rise on high volume is usually a stronger signal than a rise on low volume. A move without volume can be weak.
Moving averages
A moving average smooths the price over a chosen period (for example 50 or 200 days). A price above a long average is often seen as a rising trend, below it as a falling one. It is a lagging indicator and predicts nothing.
What technical analysis cannot do
- It does not guarantee the future. Past patterns do not have to repeat.
- It does not take the quality of the company into account. Complement it with fundamental analysis, for example the P/E ratio.
- It is subjective. Two people draw levels differently.
- Short-term trading is a risk. See CFDs.
The long-term investor and the chart
If you invest regularly in ETFs, your decisions are driven not by the shape of the chart but by your plan. See What is an ETF.
Frequently asked questions
Which timeframe is best?
It depends on the goal. A long-term investor watches years, a trader days and hours. For orientation it is good to have several timeframes on one page.
Does technical analysis work?
It is a tool for orientation and risk management, not a way to reliably predict the price.
What does YTD mean?
Year to date, the change since the beginning of the current calendar year.
For information only, not investment advice. Past prices do not guarantee future development.